How Indicator Works
Wyckoff Wave Volume for TradingView & MT4/MT5 Platform
Wyckoff Wave Volume is the best tool to identify turning points in all markets. Money plays in the market, not set ups. Therefore, in order to earn money, you must play in the same direction as the professionals! It is thanks to the observation of the volume that you can know which side the professionals (Smart Money) are on and trade in accordance with their direction. You can also "look" inside the chart and see on the numbers or graphical histogram who controls the market at a given moment - Buyer or the Seller.
Let's Start From The Beginning!
Wyckoff Wave Charts created by Richard Wyckoff were a breakthrough in technical analysis. In his famous technical analysis course, he told his students to "think like waves". Volume analysis was an integral part of his way of investing. Using Wyckoff Cumulative Volume you will be surprised how well it identifies turning points in all markets and on any time frame.
Surely you know what regular volume candles look like on a chart. Here, we will introduce you to a different view of the market and show you how to study this market and read the intentions of large players. This system is based on volume plotted on waves - aka Wave Volume - (supply/demand) that works in all markets. This system is the result of many years of work by Richard Wyckoff (a Wall Street pioneer from the 1920s and 1930s), who studied price, volume and its impact on the market. This tool is very helpful in predicting trend changes in all markets like forex, crypto, futures and stocks.
What Is Wyckoff Wave Volume and How Does It Work?
It is the sum of exchanged (sold/bought) shares or contracts on a given wave (downward or upward) in a given time.

In the EUR/USD chart, we see a classic accumulation that retains all the features associated with a change in the direction of the market. Here, the usual volume is quite important, on which we see the greatest activity. If such extremely high activity occurs after rapid declines, it means a kind of panic - some people sell in panic, others (Smart Money) take advantage of "low prices" and buy [stopping volume]. The difference between regular volume and cumulative volume is quite significant because only wave volume shows large purchases or their absence. In this case, right after the low, we see a huge volume wave of 330, which means that buyers are entering the market.
In the next phase of the market, we see the market again trying to follow the declines, but the sellers clearly lose strength - 49, 27, 23. This is a sign of a lack of supply. Then after a "false breakout" the market returns to the trading range and finally breaks it out, showing the power of buyers, which you will not see on ordinary volume.

In the GBP/USD chart, we see a typical distribution action after big gains. The market changes direction showing a sell-off on volume-marked waves. Wave 46 is the largest downward wave, after which the market forms two successive highs with very weak demand - 9 and 10. Then there is another strong sell-off - 50, after which the market again tries to follow the main direction, but the demand is too weak. High volume on downward waves means sellers are taking over. After breaking the support, the market tests the breakout point, but again we can see the lack of demand - 9. The volume histogram also shows us that the successive peaks are at a decreasing volume and the lows at a very high volume - this is a picture of the distribution of forces. Sellers are taking control and we can expect declines. Usually, volume candles do not give us important information about what is happening on the waves.

On the S&P500 chart, we see a change in market behavior - an accumulation process. The waves on which the volume is plotted show a clear decrease in selling power 354, 53, 48. The first entry of buyers is marked after the low of 354. The wave 278 is the immediate reaction of buyers and is the greatest show of strength. After the selling power is completely exhausted, the buyers take control of the market, which can be seen by the reaction strength - 474, 235, 308. The market, after hitting the Accumulation Rank, tests this level again, but we see that the supply power drops immediately (78, 7, 3, 2, 9 ) which is confirmed by a well-prepared market for growth.

Wyckoff Wave Cumulative Volume [WWCV] also works great on the stock market on any time frame. We see a great example of accumulation in the stock of Danaos Corporation [DAC]. During one session, stocks (information from the market) recorded a strong decline - 174. However, as you can see on the chart, prices in the next three months formed a sideways trend. At the beginning of December, there was an attempt to break this chart down. We see a very strong volume on a downward wave, but prices very quickly return to the rank determined by the low marked with volume 174. After this low, which is a typical trap, the market again set a higher low at three times lower volume - 70. Immediately after that we have another show of strength on subsequent peaks and finally the market breaks the range on the highest volume - 263. On the histogram we can see how the volume on the tops increases on subsequent waves, which we do not see on the usual volume used by most traders.
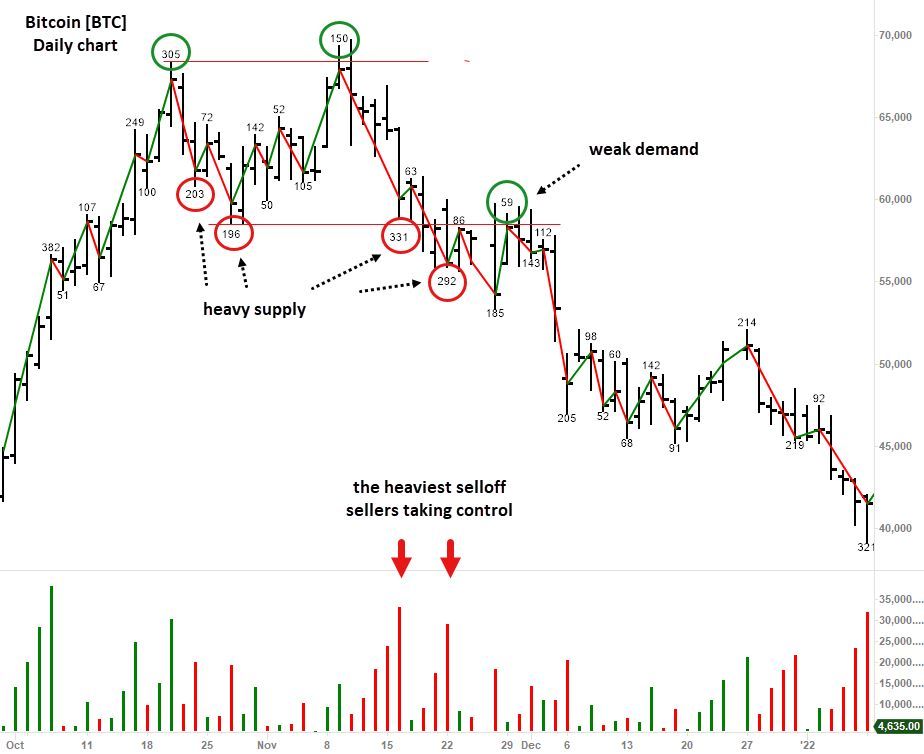
Unlike standard volume, volume on waves is very precise and gives the trader much more information about potential turning points to increase the effectiveness in trading or daytrading. Recent increases in the cryptocurrency market have also been completed with a very large sell-off, which was perfectly presented by the wave volume charts. After Bitcoin reached the peaks around USD 68k, there was the strongest sale since the moments of growth marked - 203. This is the first realization of large profits. The next sell-off was carried out on a very short wave but with a very strong volume - 196. These two lows set the level of the lower limit of the distribution process. The next high (150) was only marked by daily candles whose sessions closed below the previous high (305) - a sign of weakness. This volume was half smaller than at the previous peak. From that moment, we had declines every day, which marked the next low with the strongest downward volume in the distribution process. After breaking the support line, the price only once returned to the range with a very small volume, which confirmed the lack of supply and the continuation of declines until around USD 15k. In addition, the histogram shows how the predominance of the downward volume is growing (red).

In the chart above, we see the shares of Daq New Energy Corp [DQ]. It is characteristic to arrange prices in a sideways trend for each type of accumulation, where a large sell-off generated does not lead to further declines. This is the absorption effect. A big sell-off is absorbed by big corporate players. In the second half of April, there is even an attempt to break this range down, however, the candles close above the support. The last low marked a price of $40.89 where the large supply was completely absorbed by buyers and immediately after that buyers took the price to a new high, breaking the trading range up. Re-traversal waves after such a strong breakout area of a corrective nature because they are made on a very small volume - buyers have lost power and buyers have taken full control. The sign of strength highlighted in the chart is a typical pattern in Wyckoff analysis, which is perfectly explained in Richard Wyckoff's course for annual subscribers. This type of formation is a very common phenomenon in every market and in every time frame.

